Ski Resorts and Passes Consumer Behavior and Brand Health
Case Study
Published Q1 2023

The competition within the ski pass and ski resort space is heating up. The Ikon Pass was introduced in 2018 as a direct competitor to the Vail Resort’s Epic Pass. We conducted a deep dive investigation to better understand consumer behavior and motivations within the ski industry during the 2022-23 winter season.

Overview
Langston ran this case study to create a snapshot of brand health and consumer motivations within the ski industry during the 2022-23 winter season.
The Ikon Pass was introduced in 2018 as a direct competitor to the Vail Resort’s hegemonic Epic Pass. A central objective is to measure perceptions of ski resorts and multi-resort ski passes with a focus on which pass and associated resorts are delivering better, higher value experiences to skiers and snowboarders.
As the ski industry has shifted, ski & snowboard enthusiasts have either embraced or bemoaned the changes; however, expanding access and driving broader consumer interest is good for business. Langston is curious to understand these dynamics and predict how they may continue to change in the future.
Insights
Insight 1: Despite competitors’ growth in recent years, Epic Pass remains the category leader nationwide.
Although all four brands had 90%+ conversion from familiar to consider, Indy Pass and Mountain Collective fall behind Epic and Ikon in purchase conversion. This indicates that consumers are more likely to perceive barriers to purchase for the Indy and Mountain Collective passes. Understanding what those barriers are is critical to unlocking increased rates of conversion and subsequent growth for these brands.

Insight 2: The price of a lift ticket or pass is by far the most important factor of cost; snow/weather conditions and terrain are the most important quality drivers.
First Branch (Value Drivers): Cost has a stronger impact on perceived value than quality, indicating that when consumers are deciding where to ski/ride, they are more focused on price.
Second Branch (Quality Drivers): Among the aspects of quality, snow/weather conditions and terrain are the most important factors. Other aspects of a ski trip, like dining and entertainment, are much less important.
Second Branch (Cost Drivers): The price of a lift ticket or pass is by far the most important factor of cost in consumers’ minds. However, it is worth noting that lift lines are more important than rental costs, showing that the experience on the mountain is more important than some monetary costs.

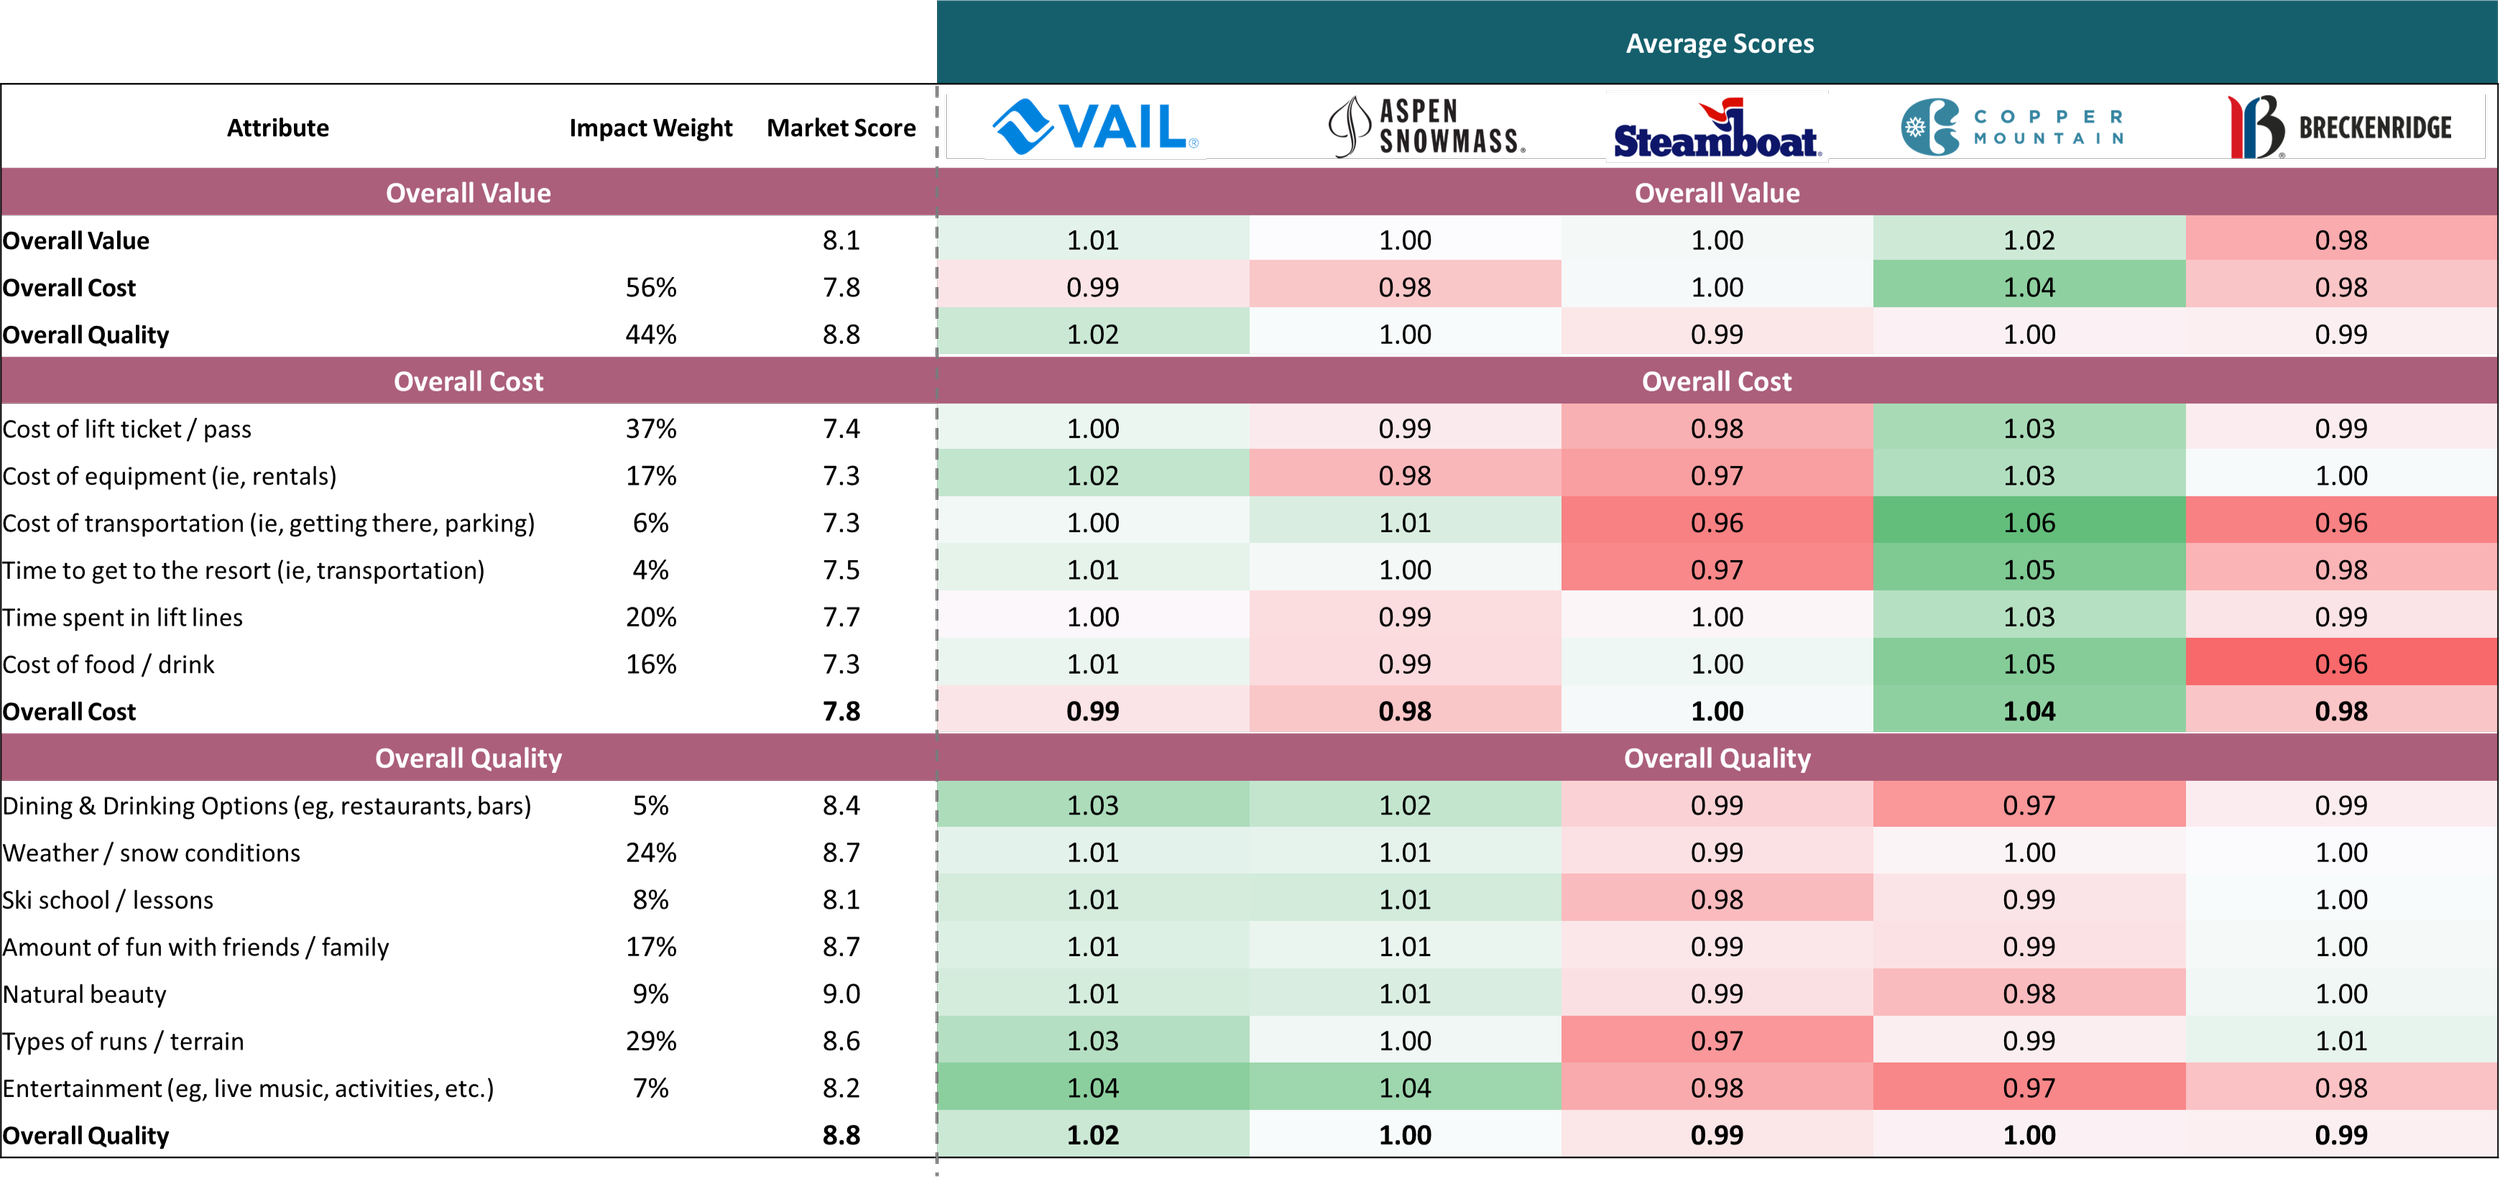
While Impact Weights tell us what is important, Performance Scores tell us how each brand is delivering along each dimension. We turn Performance Scores into ratios to show which brands are performing best (green) and worst (red) along each Cost and Quality driver.
We clearly see in the table below that Copper outperforms its peers on perceptions of lower costs while Vail and Aspen Snowmass are the category leaders in quality.
Insight 3: Perceptions of quality and popularity are strongly correlated, with Vail leading all brands on both attributes.
Copper Mountain is on the other end of the spectrum, with the lowest ratings of popularity and quality of the five resorts tested. However, as we saw in the value driver's data, there is a fine balance between being unpopular and being too popular, leading to crowded lines. While Copper should attempt to improve perceptions of quality, it should not do so by losing its identity as a friendly, convenient mountain because doing so will risk losing its advocates.


DISCLAIMER: We base our research, recommendations, and forecasts on techniques, information and sources we believe to be reliable. We cannot guarantee future accuracy and results. The Langston Co. will not be liable for any loss or damage caused by a reader's reliance on our research.
More insights, more data. Download this study to learn more.

In order to conduct unbiased and objective research, this study was privately funded by The Langston Co. We did not receive endorsement or financial support of any kind from any third party.
Thanks for taking time to read our research. With questions, comments, or suggestions about this study, please contact us at contact@thelangstonco.com.